To
assess the efficiency of the transportation network in the West Island, with a
focus on the rail mode.
1. To
assess potential ridership at train stations of the Montréal/Dorion-Rigaud line
in the West Island.
2. To
compare the potential ridership with the actual ridership to show the relative
importance of each station.
1. To
identify stations with heavy usage and propose investment plans to expand the
services, such as increasing the number of parking, improving kiss-and-ride
facility and increasing train frequency.
2. To
identify underused stations and carry out appropriate actions, such as improving
accessibility to the station, increasing the number of parking, redirecting bus
routes to the station or even eliminate the station.
It is
modified from a street network file available from the Statistics Canada. It is
dated 1993. It contains most of the streets in the West Island and the basic
attributes such as street name. The quality of the data is not perfect. A small
part of the network has digitizing errors and has to be modified. On the other
hand, some data has to be added in order to do the network analysis. This will
be discussed in the Methodology section.
It is
available as a point theme from the Agence métropolitaine de transport (AMT).
It is dated 1999 and contains all the stations in the West Island. It is used as
a reference for the network analysis. Detailed information about each station,
such as the number of parking, the schedule of trains and the number of
corresponding bus routes, is available from the AMT website.
Data
from an on-board survey conducted by the AMT at morning peak period on September
12, 2000 are available through Mr. Paul Dorval, director of commuter train
services. It can safely be assumed that the data are typical of a normal working
day and that all peak hour buses were running.
4.
Census data
Data are
available through the Computing in the Humanities and Social Sciences (CHASS)
website of University of Toronto (http://datacentre.chass.utoronto.ca/census/).
Since the census data of 2001 are not available at the time of the analysis.
Data from 1996 are being used. Three possible data categories can be used: total
population, total population 15 years and over, total employed labour force 15
years and over. Since the data of total population come from a 100% sample, they
are the most complete and accurate. It is used in this analysis. It should be
noted that it is relatively easy to change the data categories. However, results
are expected to be similar.
5.
Geographic files of the census
It is
available from Statistics Canada for the year 1996. It is essential to combine
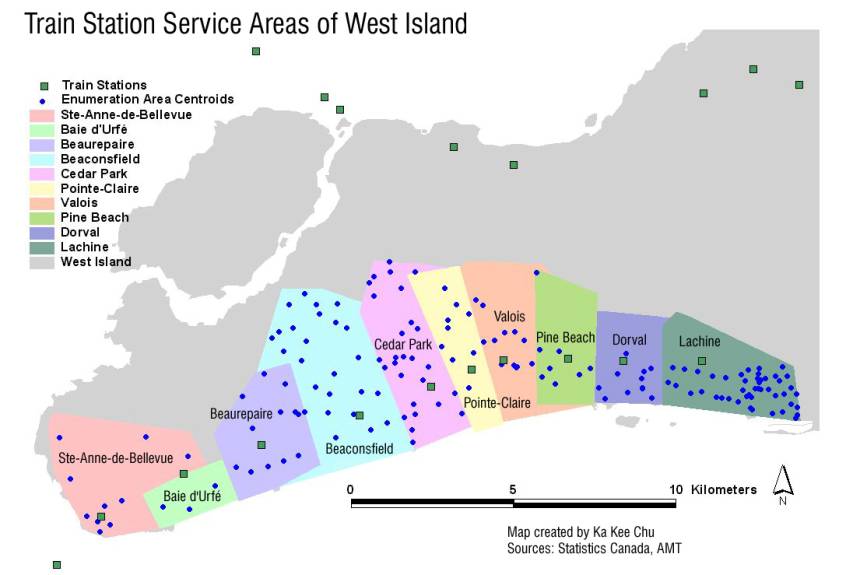
these spatial data with the census data. Enumeration area is chosen since it is
the smallest scale available. It can minimize errors and uncertainties.
Railroad
network (from Statistics Canada, 1993), base map and land use map (from Montréal
Urban Community, 1996) of Montréal are required for display purposes and for
understand the context. (See Map 1: Land
Use in West Island)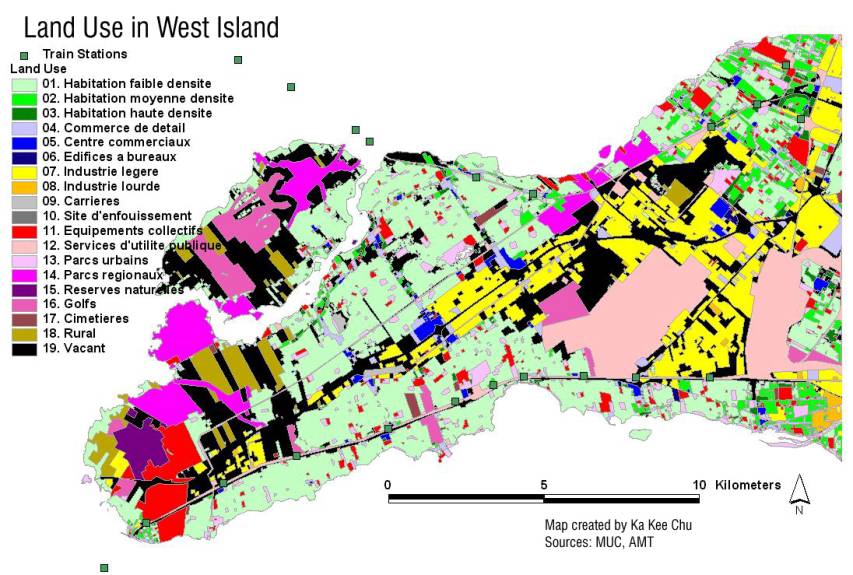
All data used
in this analysis are projected to UTM Zone 18N.
Using
the street network of Montréal as a start point, generalized impedance
information of each street (can also be called link or arc) is added. Since
actual field data are difficult to obtain, the impedance of each link is assumed
according to the size and the traffic volume of that street. It is done with the
help of a regular street atlas. Each segment of a residential street is assigned
to a traffic speed of 30 km/h and the impedance (time) is calculated by dividing
the length by the speed. 3 categories are assigned to the network: residential
street (30 km/h), major arterials (50 km/h) and autoroute (100 km/h). In this
analysis, the use of autoroute is not allowed. The assumption is that
travelers are not likely to use an autoroute to get to a station. Turns and
delays are generalized to a 30% decrease in speed. For example, a car only runs
35 km/h (50 km/h * 70%) in a major arterial. (See Map 2: West
Island Street Network)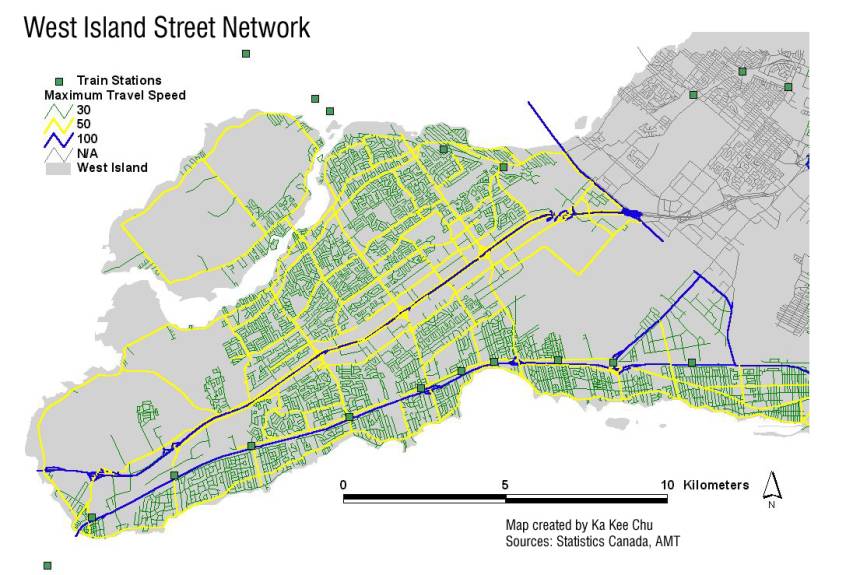
3. Analysis techniques
Once the network is setup, the analysis can be started.

Station |
Potential
Ridership |
Ridership |
Ratio |
Parking |
Number
of Bus Routes |
Index
(Average
= 100) |
|
Ste-Anne-de-Bellevue |
6222 |
485 |
7.79% |
336 |
3 |
198 |
|
Baie-d'Urfé |
2676 |
93 |
3.48% |
72 |
1 |
88 |
|
Beaurepaire |
15105 |
213 |
1.41% |
30 |
1 |
36 |
|
Beaconsfield |
25793 |
1498 |
5.81% |
465 |
5 |
147 |
|
Cedar
Park |
20376 |
334 |
1.64% |
27 |
1 |
42 |
|
Pointe-Claire |
9187 |
509 |
5.54% |
645 |
3 |
140 |
|
Valois |
6666 |
449 |
6.74% |
115 |
3 |
171 |
|
Pine
Beach |
7711 |
141 |
1.83% |
0 |
3 |
46 |
|
Dorval |
6909 |
964 |
13.95% |
402 |
10 |
354 |
|
Lachine |
28911 |
426 |
1.47% |
0 |
0 |
37 |
Total Potential Ridership: 129556
Actual
Ridership: 5112
Average Ratio: 3.95%
1. Actual Ridership to Potential Ridership Ratio
1. High ratios tend to associate with high number of parking available. All train
stations with above average indexes have equal to more than 115 parking
available. All train stations with below average indexes have equal to less than
72 parking available.
2. High
ratios tend to associate, to a less degree, with the number of bus routes
reaching the stations. All train stations having no or only one corresponding
bus route have below average indexes. All train stations having more than one
corresponding bus routes have above average indexes, with the exception of Pine
Beach.
3.
Dorval’s unusually high ratio can be explained by the fact that there are
travelers coming from the airport.
4.
Sainte-Anne-de-Bellevue’s high ratio can be explained partly by the location
of Macdonald Campus of McGill University and John Abbott College.
5. Train
stations with below average indexes are sandwiched between train stations with
above average indexes, suggesting ridership from those stations is stolen by
adjacent stations.
6. There
is no clear pattern showing train ridership varies with distance to downtown.
1.
Street network impedance does not necessarily represent the reality. However, it
is almost certainly more accurate than using distance as impedance.
2. The
assumptions used in the analysis are generally safe. However, if one of them
proves to be seriously wrong, the results can be erroneous.
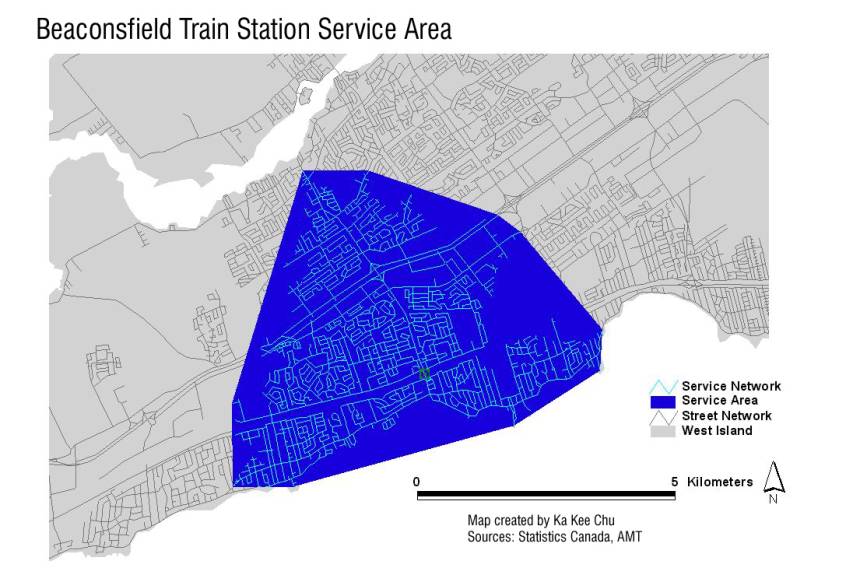
3. This
is a “Competing service area” problem. There are overlaps with the catchment
areas of the stations. Dividing using Thiessen Polygons might not be accurate
enough since people may not go to the nearest station. Instead, they go to
stations where they can reach in the least amount of time. Network Analyst
extension cannot assign areas to the nearest stations in term of time. It
can only assign point to the nearest stations.
4. A
centroid is the centre of a polygon which includes not only residential areas,
but also commercial, industrial and institutional areas. It is not
population-weighted and therefore, can only provide an estimation of the
potential train riders.
5.
Although with many complex procedures, the analysis performed may not generate
better results than using simple buffer operation around train stations.
6.
Socio-economic data (from other census categories) and travel pattern
(origin-destination survey) are not taken into account. The analysis assumes
that all people living within the catchment area are potential train riders.
However, the socio-economic profile of the residents of West Island should be
relatively homogeneous since they are mostly English-speaking suburbanites.
7. Although converted to the same projection, data coming from different sources have slight inaccuracy when they are overlaid. However, influence on the results should not be significant.
1. A
turntable, which takes into account impedance at intersections, can be included
in order to better model the street network. However, it is very time-consuming
to set up and in this analysis, it might not change the result significantly. A
sample network with turntable is setup around the station Baie d’Urfé. There
are 359 arcs in total. The turntable generated has 2160 records. Each record
should include an impedance value. According to Plumb, at a four-way stop
intersection, the impedance for a left-turn or a right-turn is 12 seconds, going
straight is 8 seconds and U-turn is not allowed. For intersection with traffic
light, the impedance varies. In this analysis, I put 60 seconds for a left-turn,
30 seconds for a right turn, 45 seconds for going straight and U-turn is not
allowed. There are also some prohibited turns to take into account, such as
overpasses and underpasses, no left-turn intersection. All of these have to be
entered. (See Map 6:
Network with Turntable)
2. To
perform the analysis again when the 2001 census data become available.
An analysis using GIS to assess the efficiency of the transportation network in West Island is done, with an emphasis on rail mode. Service areas are created using the Network Analyst extension by identifying places within a 10 minutes distance from each station. Using the centroids of the enumeration areas, population which lies within the service area are considered as potential train rider. This is then compared with the actual ridership data. The ratio ranges from 1.41% to 13.95%. This ratio is associated with the number of parking available and the number of corresponding buses. Some hypotheses are suggested to explain the results. There are several assumptions in the analysis that can influence the results. Results may be refined if more sophisticated procedures are used.
Agence métropolitaine
de transport website. <http://www.amt.qc.ca>
Easa, Said and Yupo Chan. Ed. Urban Planning and Development Applications of GIS. Reston: American Society of Civil Engineers. 2000.
Miller, Harvey J. and Shih-Lung
Shaw. Geographic Information Systems for Transportation: Principles and
Applications. New York: Oxford University Press.
2001.
Nielsen, Otto Anker. GIS-Based Method for Establishing the Data Foundation for Traffic Models. ESRI Library. <http://www.esri.com>
Plumb, Gregory. Preparing Networks for Routing Applications. ESRI Library. <http://www.esri.com>
|
Station |
Parking |
Waiting
area |
Bicycle
support |
Trains
To Montréal |
To
Rigaud-Dorion |
Buses |
|
Lachine |
on
street |
0 |
9 |
12 |
13 |
None |
|
Dorval |
402 |
7 |
14 |
12 |
13 |
190,
191, 195, 202, 203, 204, 209, 211, 221, 460 |
|
Pine
Beach |
on
street |
6 |
10 |
11 |
11 |
204,
211, 221 |
|
Valois |
115 |
12 |
18 |
11 |
11 |
203,
204, 211 |
|
Pointe-Claire |
645 |
20 |
22 |
12 |
13 |
203,
211, 221 |
|
Cedar
Park |
27 |
10 |
22 |
11 |
11 |
211 |
|
Beaconsfield |
465 |
30 |
48 |
12 |
13 |
200,
201, 217, 221, 261 |
|
Beaurepaire |
30 |
25 |
8 |
10 |
11 |
221 |
|
Baie-d'Urfé |
72 |
0 |
8 |
11 |
12 |
221 |
|
Sainte-Anne-de-Bellevue |
336 |
0 |
12 |
11 |
12 |
251,
290, 291 |
View Report in
HTML
View Report in PDF
format (Not available now due to limited storage space) Click
here to download Adobe Acrobat Reader
View PowerPoint presentation (Not available now due to limited storage space) Click
here to download PowerPoint Viewer
This web page was created by Ka Kee Alfred Chu, April 2002.
Email: Ka Kee Alfred Chu
Homepage: http://alfredchu.tripod.com